
Performance Graphs zv image

Zeevou Performance Graphs: Airbnb Dashboard and Vacation Rental Analytics

Track revenue, profit, ADR, occupancy, RevPAR and portfolio performance with visual reports that help you understand how your business is really performing.

Performance Graphs zv image

Turn Booking Data into Clear Business Direction

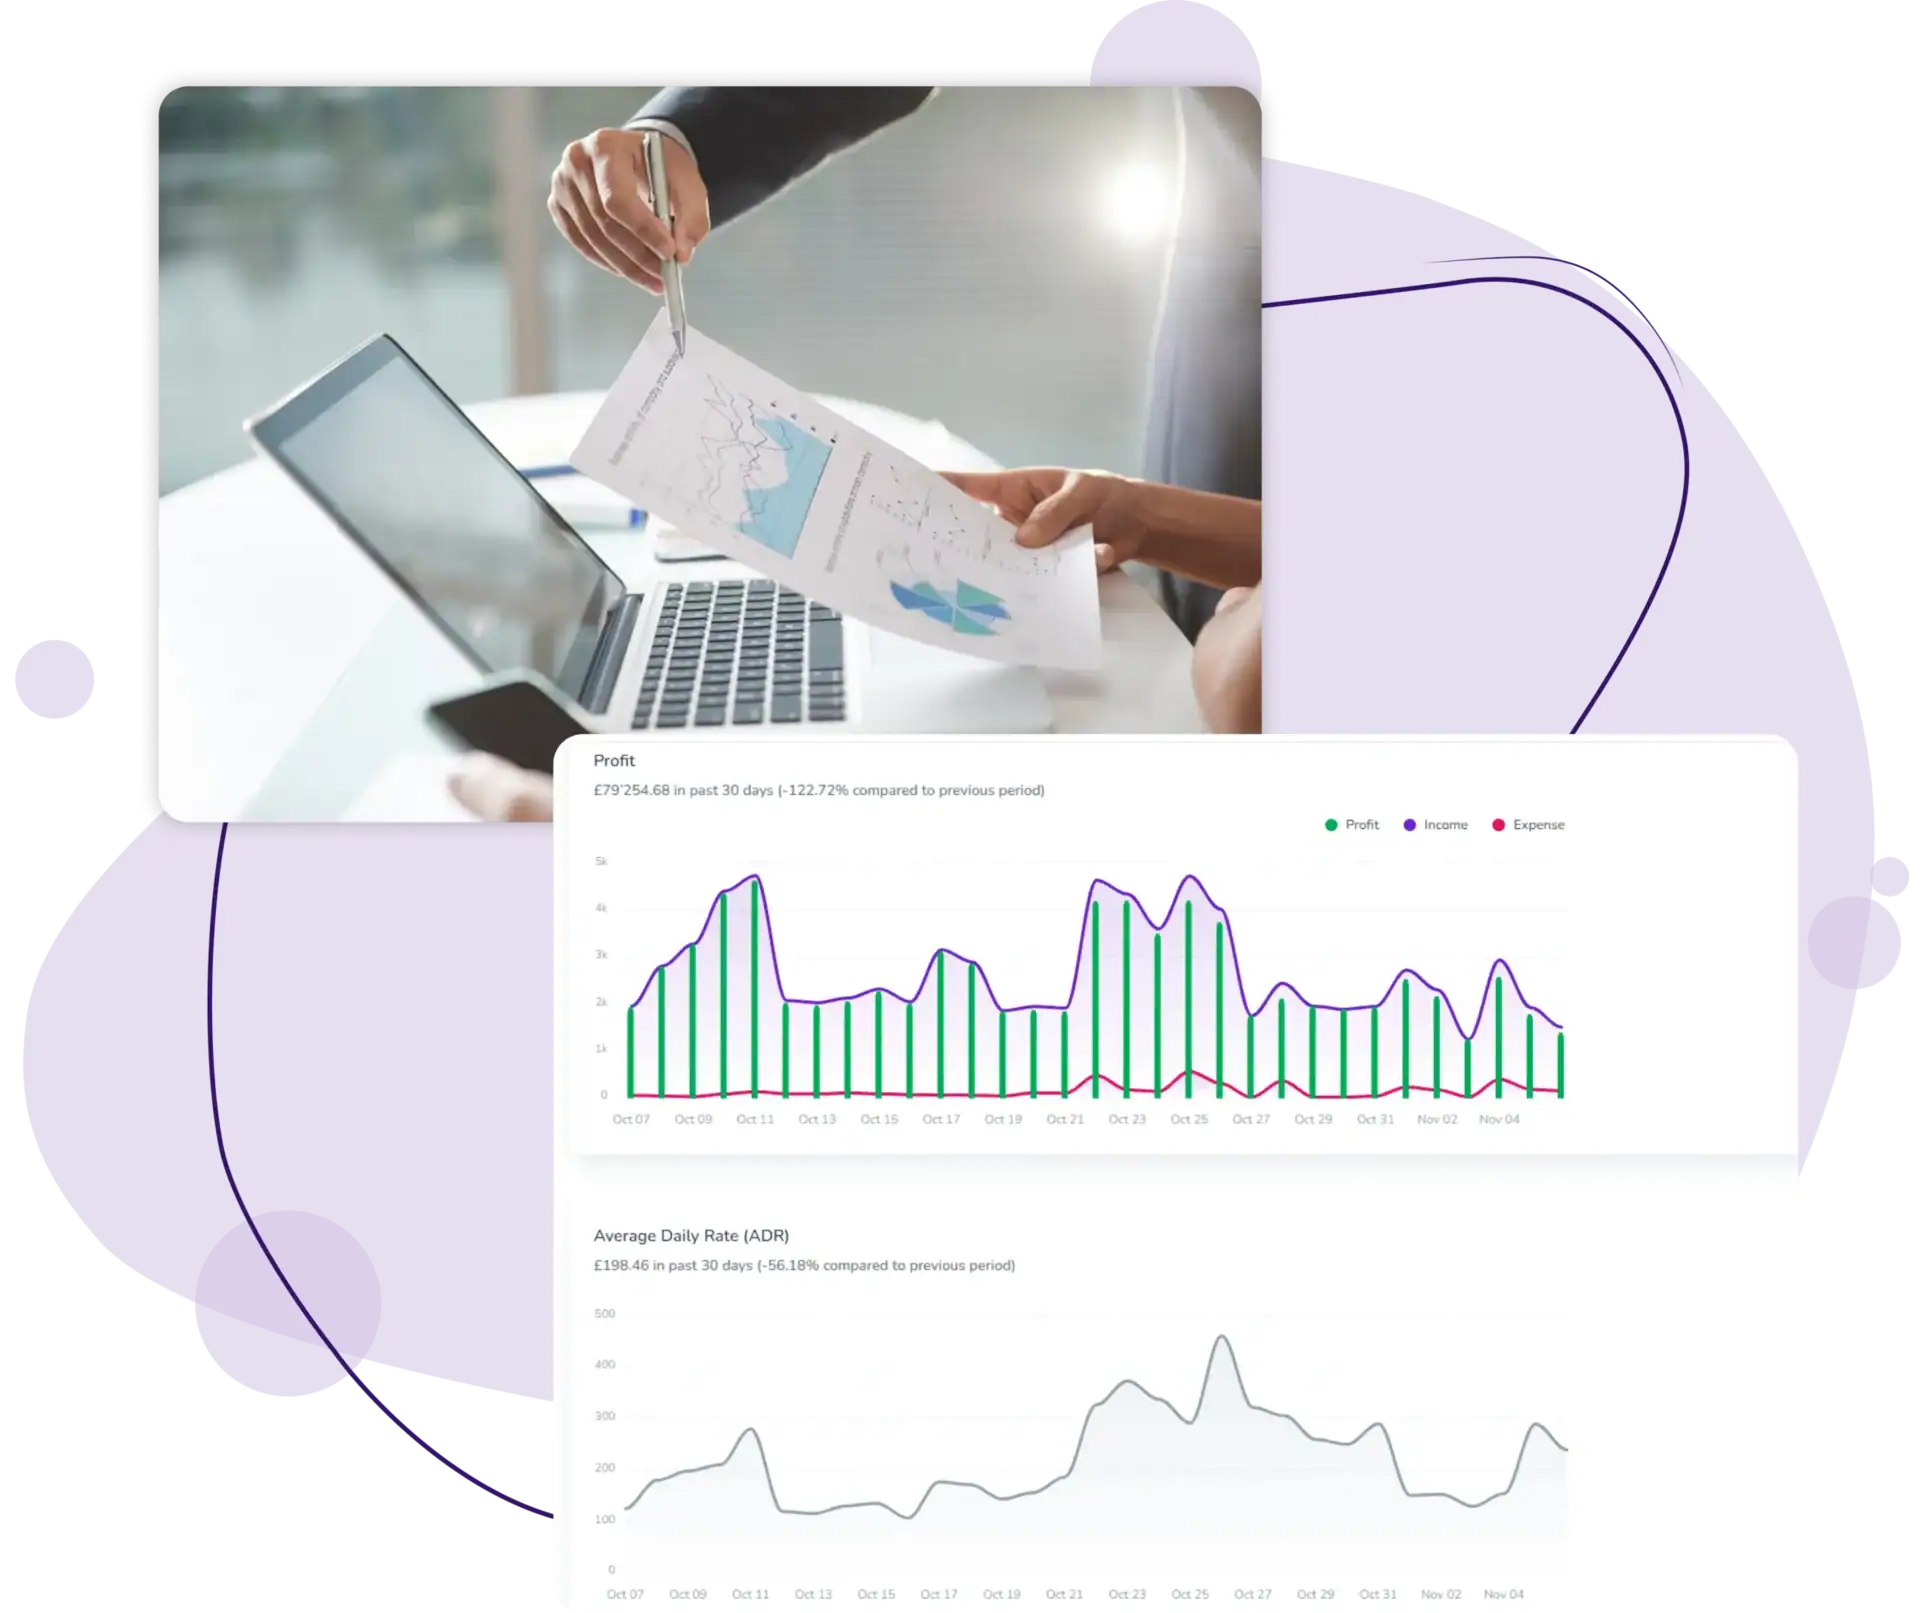
Zeevou Performance Graphs is a module that helps hosts and property managers turn booking, revenue and operational data into clearer business insights. Instead of relying on spreadsheets or gut feeling, you can use visual reports to understand revenue, profit, occupancy, ADR, RevPAR and portfolio performance.

Use revenue reporting, profit analysis, ADR charts, occupancy charts, RevPAR charts, filterable reports, saved views and easy exports to analyse your short-term rental performance and make more informed decisions.

Why Property Managers Choose Zeevou Performance Graphs

Understand Portfolio Performance

Track the key metrics that show how your properties are performing across revenue, profit, occupancy, ADR and RevPAR.

Make Data-Led Decisions

Use visual reporting to identify trends, compare performance and understand where your business may need attention.

Analyse Profit, Not Just Revenue

Look beyond top-line revenue and review profit performance alongside expenses, deductions and operating costs.

Share Clear Reports with Stakeholders

Use saved views and exports to share cleaner performance summaries with owners, investors, accountants or internal teams.

Performance Graphs Features

Revenue Reporting zv image

Revenue Reporting

Track revenue across different time periods, properties, unit types, booking statuses and channels.

Profit Analysis zv image

Profit Analysis

Analyse profit alongside revenue so you can understand business performance after costs and deductions.

ADR Chart zv image

ADR Chart

Monitor Average Daily Rate to understand pricing performance across your portfolio.
Occupancy Chart zv image

Occupancy Chart

Visualise occupancy trends and identify seasonal peaks, low-demand periods and performance patterns.
RevPAR Chart zv image

RevPAR Chart

Track Revenue Per Available Room to understand how well you are balancing occupancy and rate performance.

Filterable Reports zv image

Filterable Reports

Filter performance data by booking date, property, unit type, booking status, channel and other key views.
Saved Views zv image

Saved Views

Save frequently used report views so you can return to your most important performance data faster.
Easy Export zv image

Easy Export

Export performance reports and data so you can share them with owners, investors, accountants or internal teams.

Who Is Zeevou Performance Graphs Best For?

The Property Manager Tracking Portfolio Health

You want a clearer way to review revenue, profit, ADR, occupancy and RevPAR across multiple properties.

The Operator Comparing Property Performance

You need to understand which properties, unit types, booking channels or time periods are performing best.

The Team Reporting to Owners or Investors

You want cleaner visual reports that make it easier to explain performance and support strategic decisions.

The Revenue-Focused Manager

You want to use performance data to support pricing decisions, identify low-demand periods and review growth trends.

Real Results from Property Managers Using Zeevou

Manage with Data, Not Guesswork

Your business creates valuable performance data every day. Zeevou Performance Graphs helps you turn that data into visual reports that support better decisions around pricing, operations, Financial Reporting and portfolio growth.

Combine Performance Graphs with Pricing Rules to identify performance gaps and apply pricing logic more strategically across your portfolio.

Manage with Data, Not Guesswork zv image

Ready to See Your Portfolio More Clearly?

Track revenue, profit, ADR, occupancy, RevPAR and performance trends with visual reports that help you make more informed decisions.

Frequently Asked Questions

What is Zeevou Performance Graphs?

Zeevou Performance Graphs is a module that helps hosts and property managers track revenue, profit, ADR, occupancy, RevPAR and portfolio performance through visual reports and filterable dashboards.

Is Zeevou Performance Graphs an Airbnb dashboard?

Zeevou Performance Graphs can help you review performance data from your rental business in one place, including bookings connected through supported channels. It gives property managers a broader analytics view than relying only on an Airbnb dashboard.

What metrics can I track?

You can track performance metrics such as revenue, profit, ADR, occupancy, RevPAR and portfolio-level performance across different properties, dates, booking statuses, unit types and channels.

What is ADR?

ADR stands for Average Daily Rate. It helps you understand the average rate achieved for booked nights across your properties or selected reporting period.

What is RevPAR?

RevPAR stands for Revenue Per Available Room. It helps you understand how well you are balancing occupancy and rate performance.

Can I filter reports by property or date range?

Yes. You can use filterable reports to analyse performance by property, unit type, booking date, booking status, channel and other key views.

Can I save my favourite reports?

Yes. Saved views help you return to frequently used reporting setups more quickly.

Can I export performance reports?

Yes. You can export reports and data to share with owners, investors, accountants or internal teams.

Can I show these reports to property owners?

Yes. Performance reports can help you prepare clearer owner or stakeholder updates. For deeper owner-facing financial reporting, you can also use Zeevou Financial Reporting.

Can Performance Graphs work with Pricing Rules?

Yes. Performance Graphs works well alongside Pricing Rules because analytics can help you identify gaps, trends and opportunities that your pricing strategy can respond to.

Scroll to Top
Solution lamp for mobile header

Custom Solutions with Zeevou

Discover tailored solutions perfectly suited to your role, business size, and specific use cases.