Beyond vs Wheelhouse
In this article, we offer a detailed comparison of two revenue management tools in the market, Beyond vs Wheelhouse. The data has been collected from Beyond’s and Wheelhouse’s websites and help articles. We also checked their reviews at Capterra to find the aspects that the actual users are emphasising.
User Review
In Capterra, Beyond has a rating of 4.5, with the highest score for Customer Service.
In Capterra, Wheelhouse has a rating of 4.8, with the highest score for Customer Service.
Trustpilot introduces Wheelhouse as an Excellent tool with a 4.5 TrustScore.
Price Recommendation
Beyond asks you to come up with the base price for your listings yourself. Then, it tweaks the prices by considering seasonality, day of the week, and local events.
Beyond does not determine the appropriate base price, but it shows you a measure called the Health Score of your listing. Health Score compares your listing’s occupancy with the occupancy in the overall market. It shows you whether you need to change your base price. This tool can also consider last-minute and orphan day discounts.
Beyond creates rates for the next 12 months of your listing’s calendar.
Wheelhouse analyses your rental and its local market to provide data-driven recommendations for you. The price-setting of Wheelhouse starts with determining a base price to show how much your listing is worth depending on unique attributes and historical performance.
The Base Price Model
You do not need to come up with a base price. Instead, Wheelhouse sets it on your behalf. It looks at items like the number of bedrooms, the type of room, the listing location, cleaning fees, extra guests’ fees, etc. Wheelhouse also looks at prices that the listing achieves in the market on average. It considers their average nightly rate and utilises various factors to create a model. The aim is to predict the base price as accurately as possible. In this model, Wheelhouse also takes into account the history of the rate of a listing.
Different factors, including the location, are considered for determining the base price.
The Predictive Model
The predictive model looks at the other prices in the short-term rental market and also motel prices. It monitors price fluctuations and utilises that pricing signal as a form of intelligent forecasting of actual demand. With this early indicator, hosts and vacation rental managers can set prices very early. Wheelhouse filters the entire available data of the local surrounding listings of the market to predict the impact of local events and seasonality. By mixing them, they come up with one predictive model.
As you get closer to an event, the supply amount might make a difference, or as we have witnessed from the beginning of the pandemic, COVID-19-related restrictions might cancel events. And that is where the reactive model becomes relevant to discuss.
The Reactive Model
As real-time, transactional booking data becomes available in your market, Wheelhouse blends these insights into your pricing recommendations via the reactive model to best position your listings. For example, many events have been cancelled by getting closer to the date. Wheelhouse automatically monitors these changes in demand for every single listing every day.
Blending Demand Models
Wheelhouse blends the Predictive and Reactive models to create a pricing recommendation. The Reactive Model is weighed more as a stay date approaches when the most booking data is available. Wheelhouse’s Insights tab shows exactly how the models are being weighed for each listing, daily.
Market Intelligence
For market insights, Beyond monitors Airbnb and HomeAway/Vrbo. Beyond shows Neighbourhood Occupancy, Neighbourhood Pricing, and Hotel Pricing in the Market Data section.
In Beyond, historical occupancy is analysed to predict future occupancy. Beyond monitors Airbnb and HomeAway to get neighbourhood data.
future-looking data. This helps operators understand information like the top properties in their market or data on a particular inventory type.
In January 2021, Wheelhouse launched Benchmarking & Comparative Sets.
Comp Set selects the individual listings that you want to understand how they are performing to learn from them. You can build up different Comp Sets per property: Aspirational Comp Set, High Season Comp Set, Low Season Comp Set, Mid Week Comp Set. You can add up to 50 listings per Comp Set.
Equipped with these tools, you can check RevPAR (Revenue Per Available Night) and Lead Time of your nearby listings, as well as their nightly rate and occupancy.
For the market reports, Wheelhouse monitors Airbnb and TripAdvisor. It also has direct integration with Track, iGMS, and Smoobu.
KPI Reports
In Beyond, a measure called Health Score is defined with red, yellow, and green colours which determine how you are selling your property in the market. For example, the Health Score can show you have priced your listing too low if you are booking up too fast.
However, Beyond cannot correctly calculate the occupancy rate of multi-unit listings.
In the STATS section, you can find your recent bookings to monitor your booking pace. Beyond reports occupancy rate, Average Daily Rate, revenue by stay date, maximum daily rate, revenue per available night, revenue by booking date, average stay length, average booking lead time, bookings by booking date, and bookings by check-in date.
Wheelhouse has several KPIs for your listings’ performance. In your local market, there are three different demand curves: Seasonal Demand, Lead Time, and Length of Stay.
Wheelhouse provides several reports and analysis tools specific to your listings, given that it is in a market that Wheelhouse covers.
On the Bookings page, you can see your booking pace and revenue, which can be segmented by room type, market, or by given nicknames to allow you to better understand your booking velocity for any given night, week, or month.
In addition to the overview of the Market Report, you can also see how you compare to various tiers of competitors in your area (high vs low performers) and different tabs at the top for further insights on Trends, Historical Data, and so on.
Comp Sets shows similar listings in your area (based on Proximity, Attributes, and Booking Patterns). It provides you with data, such as their occupancy, RevPAR (Revenue Per Available Night), nightly rates, and even visibility on their listing performance and calendar.
Automation and Customisation
With Beyond, you can set your prices, and the calendar will be filled with prices for 12+ months. Furthermore, you can set minimum and maximum prices and customise minimum stay prices. Beyond lacks the grouping feature, which is very useful when you need to manage numerous listings.
It does not support the differentiation of minimum length of stay for weekdays and weekends, and it does not allow the automatic updating of a minimum length of stay for far-out bookings, either. However, minimum stay can be automatically adjusted for last-minute bookings and orphan days.
The Wheelhouse Pricing Engine analyses 10 billion data points every night. The software’s settings allow you to customise your pricing engine, too. You can either set your base price or choose one of the recommended base price strategies by Wheelhouse.
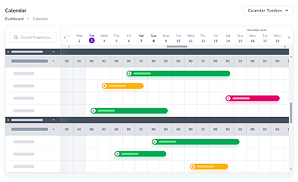
The suggested prices will then appear on your calendar every day for up to 18 months in advance.
If you have an extensive Portfolio, Wheelhouse also has portfolio-level tools.
Wheelhouse includes dynamic minimum stays, customisable last-minute discounts, weekend rate adjustments, seasonality adjustments, etc.
You can also select “conservative,” “recommended,” or “aggressive” approaches as your pricing preference. Conservative mode puts a higher priority on your listings occupancy. Recommended mode offers a balanced approach between occupancy and earning potential. And Aggressive mode puts the emphasis on the average daily rate.
Pricing
Beyond offers two different payment options, Pay on Book and Pay on Stay.
Pay on Book: All accounts are set to Pay on Book by default. When a booking is made, you are charged 1% of the total, including fees and excluding tax and security deposits. Also, annual plans require a yearly commitment.
Pay on Stay: In case you prefer to be charged at the time of the stay, you can choose Pay on Stay, which charges 1.49% on the day of check-in.
Beyond offers a 30-day free trial, as well as a free Insights service.
Wheelhouse has set two pricing plans: either 1% of your revenue (which does not include taxes or fees) or a Flat Rate per listing per month, depending on portfolio size. You can sign up for free and use the Wheelhouse Platform without entering your credit card details. You can also enjoy using the Market Report tool for free.
Where Do Wheelhouse and Beyond Get Their Data from?
Wheelhouse has a partnership with KeyData. This company has access to data on different marketplaces like Airbnb and TripAdvisor and native Vrbo data. According to Wheelhouse, KeyData also has a unique data set containing information on homes that are not sold in any of the mentioned OTAs.
Beyond pulls market data from Airbnb and HomeAway/Vrbo.
Beyond vs Wheelhouse: Which Revenue Management Tool to Choose?
Both Wheelhouse and Beyond are excellent pricing tools, with their own unique benefits. Which one you choose ultimately comes down to the specific features that are of interest to you.
Beyond’s emphasis on customer satisfaction has led to the creation of more innovative and useful tools. Moreover, they offer a large selection of free resources and tutorials so that anyone can use their products easily.
Wheelhouse is a user-friendly tool that is known for its customisable pricing models. Moreover, this platform breaks down its recommendations, so you know why you’re being recommended a certain price.
Take advantage of the free trials of both Wheelhouse and Beyond to decide which is best for your business. And keep in mind that, even though these tools are smart, they still require regular monitoring and customisation!
We are committed to ensuring that all our comparison articles are factually entirely correct and accurate. If you have spotted anything that you feel is wrong or misleading in this article, we’d appreciate hearing from you.


