
Many successful property managers reach a point where growth feels more like chaos than progress. With dozens of properties, the spreadsheets multiply, profitability becomes a mystery, and you spend your days putting out fires instead of building an empire.
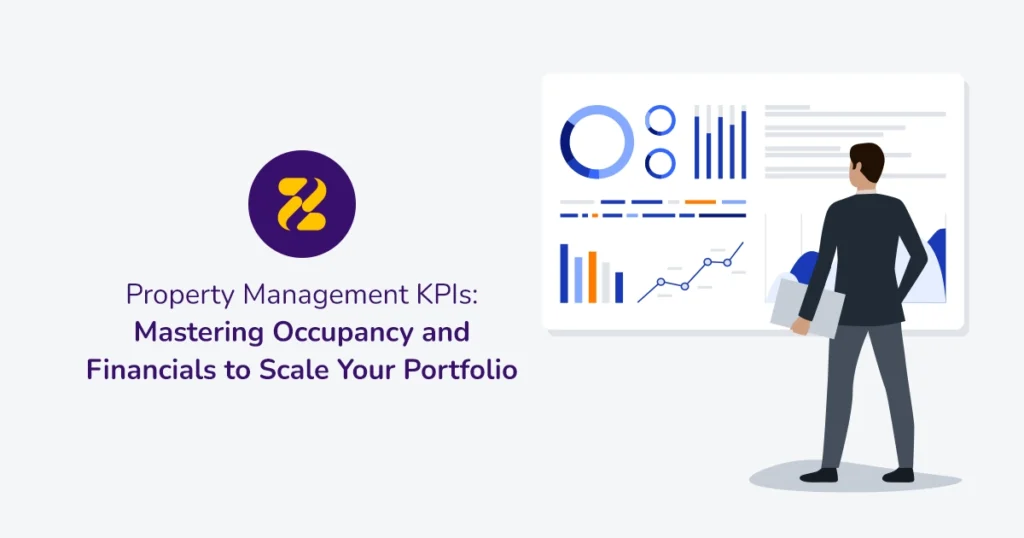
If this sounds familiar, you’re at a crossroads. The way forward isn’t working harder; it’s working smarter. The solution is to trade the chaos for a compass: your property management KPIs. These key performance indicators are the navigation system for your business, transforming you from a reactive operator into a strategic CEO. This guide cuts through the noise to focus on the essential property management KPIs that drive real growth.

Table of Contents
The CEO Mindset: Leading vs Lagging Indicators
First, a crucial mindset shift. Metrics like total revenue are lagging indicators; they tell you what already happened. It’s like getting a speeding ticket in the post; the mistake is in the past.
Strategic leaders focus on leading indicators – metrics that predict future success. Think of your car’s speedometer; it lets you correct your course in real-time to prevent the ticket. For property managers, leading indicators like maintenance speed and guest satisfaction scores are their speedometer. This property management KPI help hosts fix small issues before they become bad reviews and lost revenue
The Financial Masterclass: 3 KPIs for True Profitability
With the right mindset in place, let’s calibrate our financial compass. These KPIs cut through the noise of vanity metrics to reveal the true financial health of your portfolio.

1. Net Operating Income (NOI)
What it is: The gold standard of profitability. It’s your total revenue minus all operating expenses (like cleaning, commissions, and utilities), but excluding mortgage payments and taxes.
NOI = Total Revenue − Operating Expenses
Why it matters: NOI is the great equaliser. It lets you compare the true performance of a city flat and a country house on an apples-to-apples basis, revealing your genuine cash cows.
Actionable Strategy: To improve your NOI, you have two levers: increase revenue or decrease costs. Start by conducting a thorough cost audit. Are your utility bills creeping up? Is one cleaning team significantly more expensive than another? Are OTA commissions eating away at your margins? Tracking NOI forces you to scrutinise every line item and cut the fat, turning a bigger slice of your gross income into pure profit.
2. Revenue Per Available Rental (RevPAR)
What it is: A masterclass in efficiency, blending your daily rate with your occupancy. It shows the revenue generated for every available night, booked or not.
RevPAR = Average Daily Rate (ADR) × Occupancy Rate
Why it matters: RevPAR stops you from the cardinal sin of chasing 100% occupancy by slashing prices. It forces a strategic balance between your rate and your calendar to maximise total revenue.
Actionable Strategy: Mastering RevPAR is the art and science of revenue management. This means leveraging dynamic pricing tools that analyse a torrent of market data – seasonality, local events, competitor pricing, and booking lead times – to set the optimal price for every night. With future bookings showing strong ADRs through summer, and rates projected to hit £340 in July, a sophisticated RevPAR strategy is essential.
3. Gross Operating Profit Per Available Room (GOPPAR)
What it is: The CEO’s view of profitability. Where RevPAR tracks revenue, GOPPAR tracks pure profit on a per-unit basis.
GOPPAR = Total Available NightsGross Operating Profit (GOP)
Where Gross Operating Profit (GOP) is your Total Revenue minus your Total Operating Expenses.
Why it matters: This is the ultimate performance metric. It answers the most critical question: “For every night a property is available, how much profit does it generate?” It combines revenue generation with cost control, revealing the true efficiency of your assets.
Unlock the story your data is telling; transform complex KPIs into clear, profitable decisions with Zeevou’s intelligent analytics dashboard.
Actionable Strategy: Improving GOPPAR involves a dual focus. First, maximise total revenue, not just from rooms but from ancillary sources like pet fees, early check-in charges, or experience upsells. Second, aggressively manage operating costs by streamlining operations, negotiating better terms with suppliers, and investing in energy-efficient technology.
The Engine Room: 3 Operational KPIs for a Flawless Guest Experience
Financials tell the score, but operations win the game. A well-oiled machine is the primary driver of guest happiness and long-term success.
4. Occupancy Rate
What it is: The percentage of available nights that were successfully booked.
Occupancy Rate (%) = (Number of Available Nights / Number of Booked Nights) × 100
Why it matters: The real power is in the detail. Tracking occupancy per property against your local competition reveals whether a poor-performing unit is a victim of the market or a problem with the listing itself.
5. Average Length of Stay (ALOS)
What it is: The average number of nights guests stay at your properties.
Why it matters: Every turnover costs money in cleaning and admin. Increasing your ALOS, even by one night, can dramatically boost your bottom line by reducing operational churn.
6. Maintenance Turnaround Time
What it is: The time elapsed from a guest reporting an issue to the moment it’s fully resolved.
Why it matters: This is the most critical leading indicator of guest satisfaction. Data shows that if a repair takes longer than 5.5 days, your chance of getting a positive review drops to nearly zero. A slow response isn’t just poor service; it’s a financial liability.
The North Star: 3 Guest-Centric KPIs That Build an Unbeatable Brand
Ultimately, the short-term rental business is a hospitality business. A strong brand built on guest satisfaction is your most durable competitive advantage in airbnb management. These KPIs are your North Star, guiding every decision toward building that brand.
7. Guest Satisfaction Score
What it is: The average star rating from guest reviews across all platforms.
Why it matters: This is the ultimate leading indicator of your business’s long-term health. In the world of OTAs, algorithms reward quality. Higher guest satisfaction scores lead to better search rankings, which leads to more visibility, which leads to more bookings. It creates a virtuous cycle.
Furthermore, a consistently high score is a powerful signal of brand quality that allows you to command higher nightly rates and fosters a loyal base of repeat guests. As one analysis points out, companies that lead in customer experience outperform laggards by a significant margin, a principle that holds true in Airbnb management.
Actionable Strategy: Don’t just hope for good reviews; engineer them. This starts with excellent operations, but it ends with proactive communication. Automate post-stay messages that thank guests for their stay and politely ask them to share their experience. Make it easy for them by providing direct links to the review platforms. A simple, well-timed thank-you note can be the nudge that turns a happy guest into a five-star advocate for your brand.
8. Booking Conversion Rate
What it is: The percentage of potential guests who view your listing and proceed to make a booking.
Conversion Rate (%) = Total Number of Enquiries or ViewsTotal Number of Bookings × 100
This metric is a direct measure of how effective your online shop window is.
Why it matters: You can spend a fortune on marketing or achieve a top ranking on Airbnb, but if browsers aren’t turning into bookers, you’re pouring water into a leaky bucket. A low conversion rate indicates a mismatch between what guests are looking for and what your listing is communicating. It’s a direct signal that something in your listing – be it the price, the photos, the description, or your response time to enquiries – is causing friction.
Actionable Strategy: Treat your listings like a science experiment. A/B test your headlines. Swap out your lead photo and track the impact on enquiries. Most importantly, focus on your response rate. A fast response to an initial enquiry dramatically increases the likelihood of converting that enquiry into a booking. Aim to respond to all messages in under an hour, if not minutes. This speed not only impresses the guest but also pleases the OTA algorithms, further boosting your visibility.
9. Guest Lifetime Value (LTV)
What it is: The total net profit you can expect to make from a single guest over their entire relationship with you.
Why it matters: LTV transforms your perspective on marketing and service. It justifies spending more to acquire and retain guests by proving the long-term financial payoff of loyalty.
Actionable Strategy: To calculate LTV, you need to track guest data over time. A simplified approach involves three key components: average profit per stay, repeat booking frequency, and guest lifespan.
To increase LTV, focus on driving repeat bookings. Implement post-stay email campaigns with exclusive offers for past guests, create a simple loyalty programme, and personalise communication to make guests feel valued and encourage them to book directly for their next trip.

The Portfolio Manager’s KPI Dashboard
To bring it all together, here is a concise dashboard that summarises the most critical KPIs from a strategic, CEO-level perspective.
| KPI Category | Key Performance Indicator | Formula / Definition | Why It’s Crucial for Scaling Portfolios (The “CEO View”) |
| Financial | Net Operating Income (NOI) | Total Revenue – Operating Expenses | Reveals the true profitability of each asset, guiding investment and divestment decisions. |
| Financial | RevPAR | ADR x Occupancy Rate | Measures the strategic balance between price and occupancy to maximise overall revenue generation. |
| Financial | GOPPAR | Gross Operating Profit / Available Nights | The ultimate measure of per-unit profitability, combining revenue generation with cost control to assess true operational efficiency. |
| Operational | Maintenance Turnaround Time | Time from request to completion | A primary leading indicator of guest satisfaction that directly prevents negative reviews and protects asset value. |
| Guest-Centric | Guest Satisfaction Score | Average of guest review ratings | The ultimate predictor of future bookings, brand reputation, and long-term financial health. |
| Guest-Centric | Guest Lifetime Value (LTV) | (Avg Profit per Stay) x (Repeat Frequency) x (Lifespan) | Quantifies the long-term value of guest loyalty, guiding strategic decisions on marketing spend and retention efforts. |
From Data to Dominance: Your Zeevou Command Centre
Tracking every property management KPI across a large portfolio with spreadsheets is a recipe for burnout and error. A professional Property Management System (PMS) is the essential command centre for any serious operator.
Zeevou is designed to be your single source of truth, turning raw data into actionable intelligence.
- Zeevou’s interactive dashboard automatically calculates your Revenue, Profit, ADR, Occupancy, and RevPAR in real-time, eliminating manual work.
- With this data foundation, you can easily calculate advanced metrics like NOI and GOPPAR.
- The unified inbox and task management features give you precise control over your Maintenance Turnaround Time.
- By centralising guest data, Zeevou provides the history needed to calculate a meaningful Guest Lifetime Value (LTV).
A powerful PMS delivers an “Automation Dividend” – the time you reclaim from admin can be reinvested into high-value growth activities, like optimising your pricing or scouting your next property.
To truly master your portfolio’s finances, your KPI dashboard needs to be built on a rock-solid foundation. You can explore how to achieve this in our Blog Post Mastering Property Management Accounting Software: Empowering Short-Term Rental Managers in 2025.
Conclusion: The Foundation of Trustworthy KPIs
Mastering the KPIs in this guide is the key to scaling your portfolio, but these powerful metrics are only as reliable as the data behind them. This is where robust property management trust accounting software becomes indispensable. Its core function is not just about compliance; it’s about guaranteeing the integrity of your most critical financial property management KPIs.
Accurate calculations of Net Operating Income (NOI) and Gross Operating Profit Per Available Room (GOPPAR) are impossible without the meticulous fund segregation that trust accounting provides. By preventing the commingling of funds and automating the complex ledger of deposits and payouts, it ensures that every pound of revenue and expense is allocated to the correct property. Without this financial clarity, your KPIs become unreliable estimates, leading to flawed strategic decisions.
Ultimately, trust accounting software is the engine of financial truth for your portfolio. It builds unwavering owner trust through transparency and eliminates the risk of costly errors, safeguarding your business from legal repercussions. It ensures that when you look at your KPI dashboard, you are seeing a true reflection of your business’s health, empowering you to make confident, data-driven decisions to scale your empire.
Image by pch.vector on Freepik.